Juliette Bezaire, Benjamin Boyd, Marin Chalmers, Margaret Herman, Elizabeth Smith, and Natalie Wong, Oak Park and River Forest High School, Oak Park, Illinois, United States
Reviewed on 3 May 2025; Accepted on 9 June 2025; Published on 27 October 2025
With help from the 2025 BioTreks Production Team.
The goal of this project is to minimize the output of methane from agriculture using synthetic biology techniques. Ex vivo studies suggest that flavonoids, a class of compounds formed by plants, could inhibit creation of the enzyme methyl coenzyme M-reductase (MCR), which promotes methane production. By inhibiting MCR, methane generation should also be inhibited. We hypothesize that expression of flavonoid precursor enzymes flavonol synthase (FLS) and flavanone-3-hydroxylase (F3H) in agricultural feedstock will reduce methane generation via the production of synthetic flavonoids, which then inhibit MCR. The genes for two flavonoid precursor enzymes, FLS and F3H, from Cavendish bananas, Musa acuminata, will be inserted into separate PET-21+ plasmids with different fluorescent protein genes (pAsRed2 and pAmCyan) and coexpressed in E. coli. Fluorescence will indicate successful gene expression of the banana’s flavonoid precursor enzymes in E.coli. Assuming successful transformation, our next steps would be to test if FLS and F3H can reduce production of methane ex vivo. After, we would insert our genes into a feed crop and determine if there is an increased expression of flavonoids. Minimizing methane emissions usings synthetic biology provides groundwork for developing sustainable and cost-effective ways to mitigate greenhouse gas emissions.
Keywords: Flavonoids, methane, aAgriculture, MCR, methanogens
Authors are listed in alphabetical order. Matthew Kirkpatrick and Jennifer Watson mentored the group. Please direct all correspondence to jenniferwatson@limuless.com.
Background
Currently, cattle digestion accounts for 45% of total methane emissions nationally. In the atmosphere, methane gas traps heat and contributes to climate change. Since 1980, global temperatures have increased by an average of 0.06 °C per decade, and methane gas is responsible for about 30% of that increase. Compared to other greenhouse gases, methane has a relatively short atmospheric lifetime of 12 years, but traps far more heat than CO2. This makes methane an ideal target for reducing global warming rates. Lowering methane emissions will slow the accumulation of greenhouse gasses in the atmosphere and contribute to reducing climate change.
In our research, we aim to mitigate methane emissions from ruminant livestock through the use of flavonoids. Flavonoids are polyphenolic compounds that suppress the process of methanogenesis, a form of anaerobic respiration that results in the production of methane gas (CH4). In ruminant livestock, methanogens located in the rumen use the enzyme methyl-coenzyme M reductase (MCR) to execute methanogenesis. MCR is inhibited by the flavonoid kaempferol, whose final steps of synthesis are catalyzed by the two flavonoid precursor enzymes, flavonol synthase (FLS) and flavanone-3-hydroxylase (FH3) (Duan, et al.). Enhancing kaempferol production using bioengineering methods will allow us to express kaempferol within plants used for cattle feed at higher levels than naturallyoccurring kaempferol. We hypothesize that the expression of FLS and F3H in agricultural feedstock will increase kaempferol, which inhibits MCR and, consequently, limits methanogenesis.
MMOs are enzymes used by methanotrophs, a type of Archaea, to oxidize methane (CH4) into methanol (CH3OH). Initially, we considered the use of methane monooxygenases (MMO) to increase the rate at which methanotrophs break down methane. By expressing MMOs and introducing them into an environment with methanotrophs and methane, we aimed to increase the rate at which methane is converted into a less harmful compound. After further research, we found that expression of a large protein like an MMO is beyond the scope of our project, and we realigned our goals to the expression of flavonoids, which instead prevent methane from being produced in the first place rather than the oxidation of methane after its formation.
With human populations and the agricultural industry growing quickly, methane emissions are also projected to increase. Addressing methane emissions is urgent because it is vital to address climate change and protect the health of our planet.
Materials and Methods
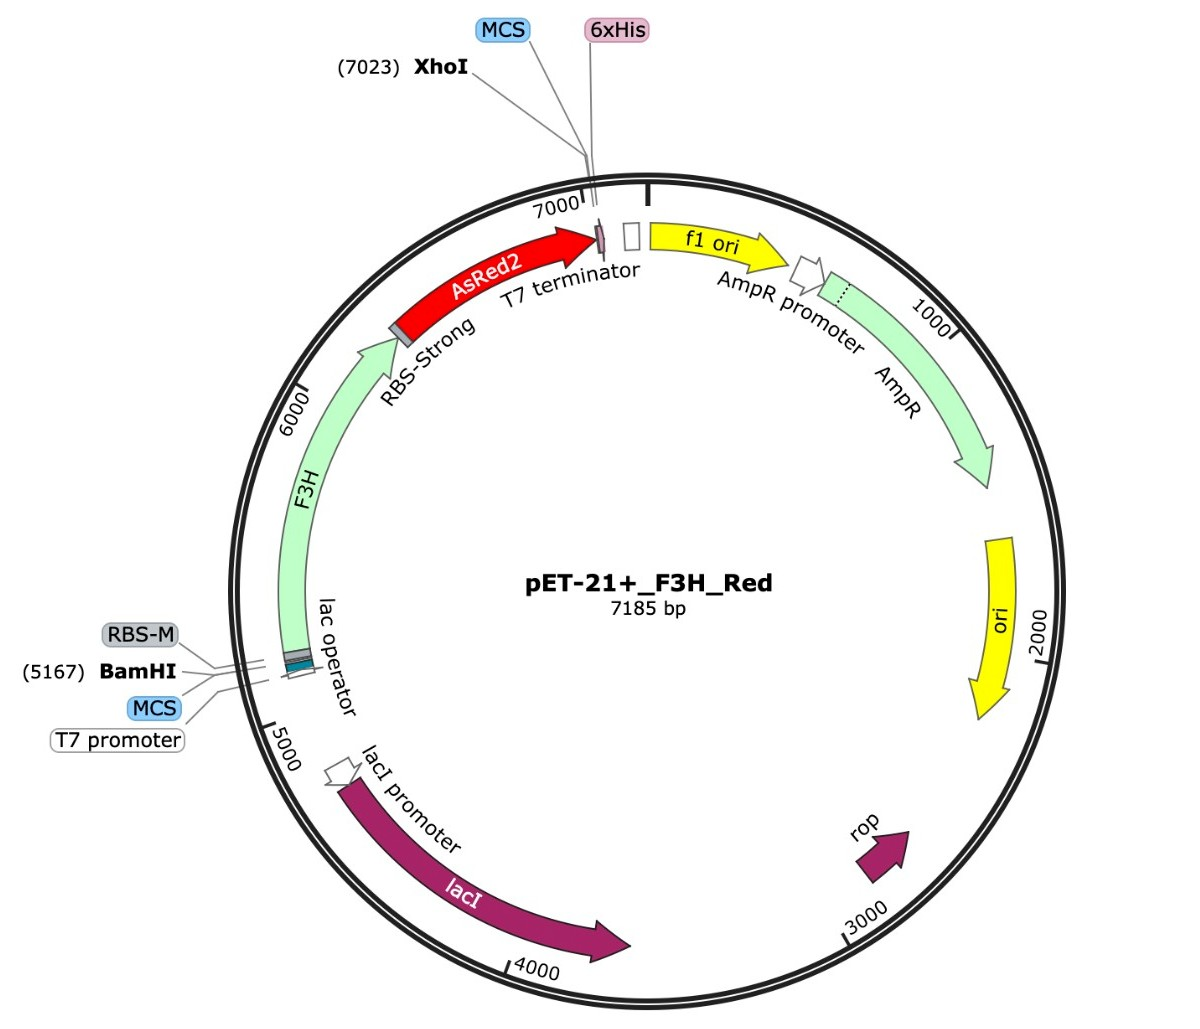
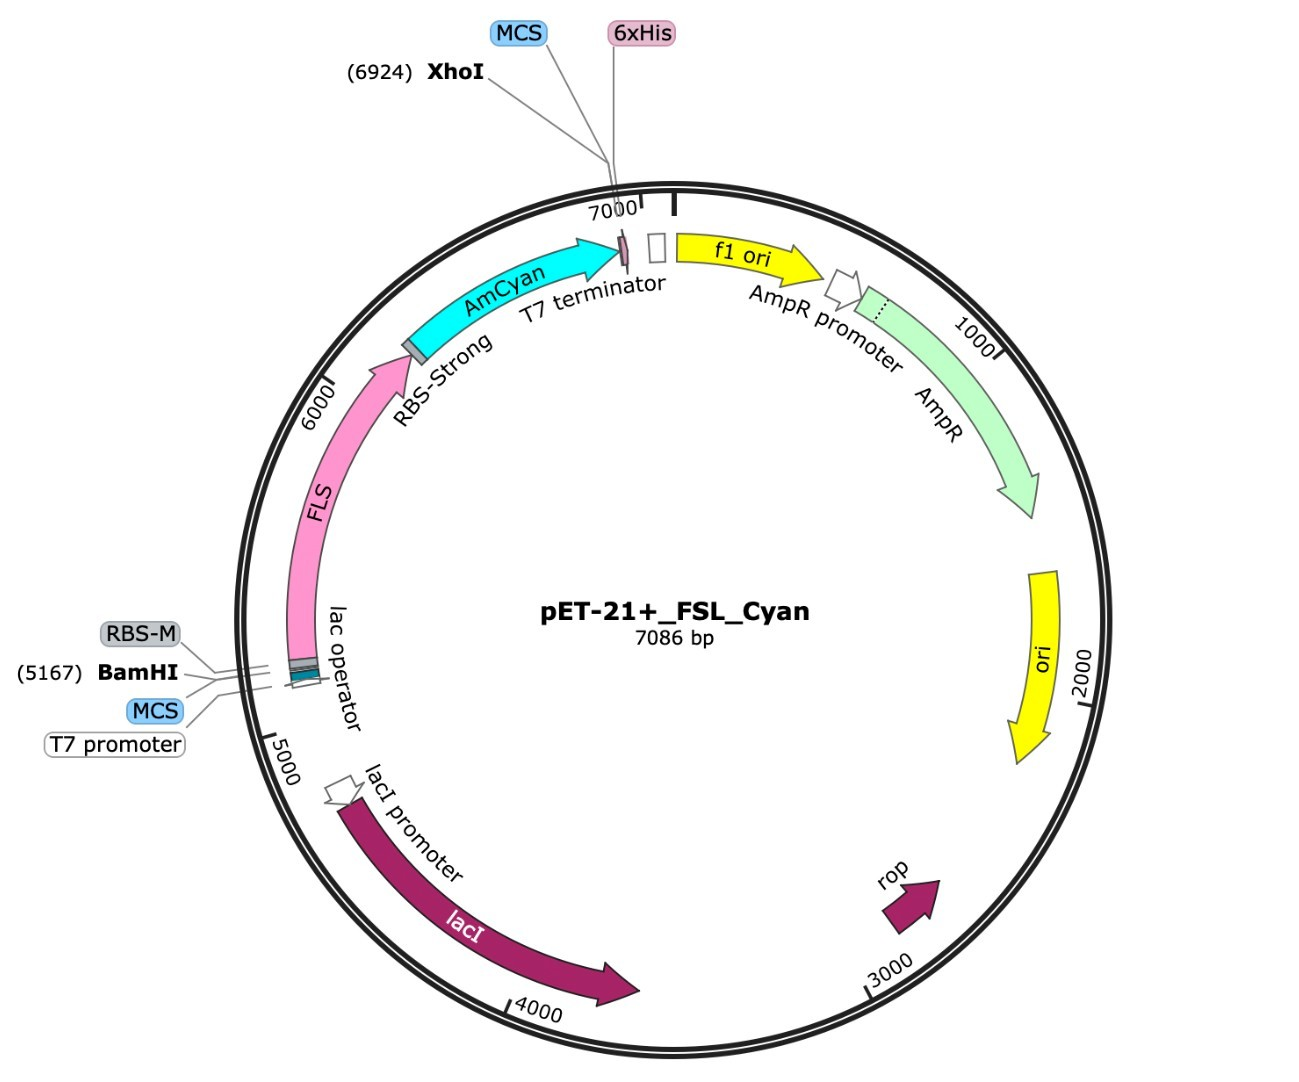
For our chassis, we decided to use Escherichia coli K-12. We decided to use two separate plasmids to express our genes of interest (Fig. 1).
| Figure 1. a) pET-21+ plasmid design with red fluorescent protein and F3H genes b) pET-21+ plasmid design with blue fluorescent protein and FLS genes. |
|
|
|---|
One plasmid expresses the FLS gene and the other expresses the F3H gene. We used the plasmid Pet21+, which has an ampicillin resistance gene and two insert sites to express two different genes. For the first plasmid, we inserted the blue fluorescent protein gene, pAmCyan, along with the FLS gene. Blue fluorescence would indicate expression of the FLS protein.
We repeated the procedure with the FH3 gene but instead inserted a red fluorescent protein, pAsRed2. This ensures that both plasmids can be tested separately to confirm individual expression. Additionally, the promoter upstream of the FLS/F3H gene and fluorescent protein gene is activated using isopropyl-β-D-thiogalactopyranoside (IPTG). As seen in Figure 1, the ampicillin resistance gene does not share the promoter and will be expressed without the activator. When both plasmids are tested together with the activator and measured via light spectrometry, two distinct wavelength peaks are expected at approximately 470 nm (blue) and 570 nm (red). This will indicate that both proteins coded for by our genes of interest are coexpressed.
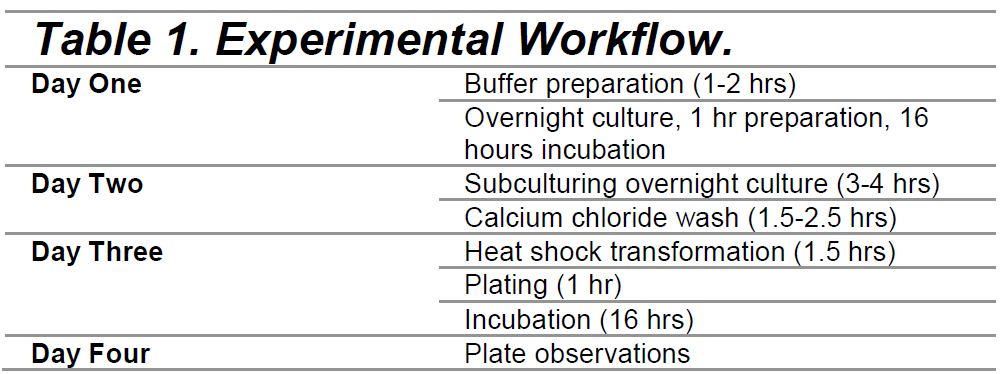
We introduced our plasmids into E. coli via heat shock transformation following previously-published methods(Chang et al., 2017). Our experiment took 4 days (Table 1).
|
|---|
Buffers and cultures were prepared the day before. An overnight culture was prepared using 1 mL of LB with E. coli, which was then placed on a shaking incubator at 37 °Celsius and 200 rpm for 16 hours. The next day, we subcultured our overnight cultures, adding 1 mL of the overnight culture to 99 mL of fresh LB. The solution was then shaken in an incubator at 37 °Celsius and 200 rpm for 3-4 hrs. Next, we used a calcium chloride wash (0.1 M CaCl2) and a 0.1 M CaCl2 + 15% glycerol solution, both ice cold. After allowing the subcultures to grow for 3-4 hours, the subcultures were pelleted and washed with 0.1 M CaCl2. Then, heat shock transformation was used to introduce our plasmids. After incubation at 37 °Celsius at 200 rpm for one hour, we prepared 1:10 dilutions of the cells in LB broth. Our activator, IPTG, was added at a concentration of 0.1 mM.
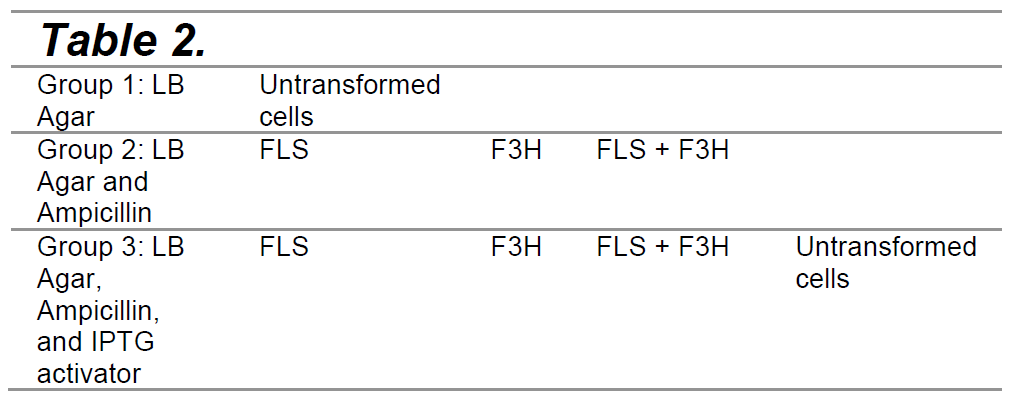
Finally, three groups of agar plates were prepared for experimentation using our bacteria (Table2)
|
|---|
TREATMENT GROUP CELL TYPE REPLICATES?
FLS: E. coli cells transformed with the plasmid containing the FLS and cyan fluorescent protein genes.
F3H: E. coli cells transformed with the plasmid containing the F3H and red fluorescent protein genes.
FLS + F3H: E. coli cells transformed with both the FLS and F3H plasmids.
The E. coli cells used across all of the plates came from separate test tubes, each being transformed with different plasmids/plasmid combinations (or untransformed cells) and LB broth in a 1:10 ratio. Group 1 contained untransformed E. coli cells from our test tube with a 1:10 cell to LB broth ratio. These cells were plated on the agar plates with no additional antibiotics or activators. Group 2 contained one plate with E. coli cells transformed with our FLS plasmid, one plate with E. coli cells transformed with our F3H plasmid, and one plate with E. coli cells transformed with both of the plasmids. Group 1 was used as a positive control to indicate that the selected E. coli species could grow with and without transformation (without the presence of Ampicillin to select for transformed cells) (Figure 4). Group 2’s plates contained LB and Ampicillin. Group 3’s plates contained LB, Ampicillin, and the activator (IPTG). Within the second and third groups, there were three experimental plates per group. One plate contained cells with the FLS plasmid. The second plate contained cells with the F3H plasmid. The third plate contained cells with both the FLS plasmid and F3H plasmid. Group 3 also had a negative control plate with untransformed E. coli cells, on which we expected to see no growth due to the presence of ampicillin and lack of genes that could receive the activator.
After letting the cultures grow, we measured the fluorescence wavelength and intensity with the activator present. Since both plasmids have inserted fluorescence genes along with FLS/F3H genes, expression of fluorescent proteins will most likely correspond with, and indicate, expression of FLS/F3H proteins. Additionally, we cultured our cells in LB and measured cell growth via a spectrophotometer.
After completing the procedure, we disinfected our work surfaces. Otherwise, we did not have any safety concerns.
Results
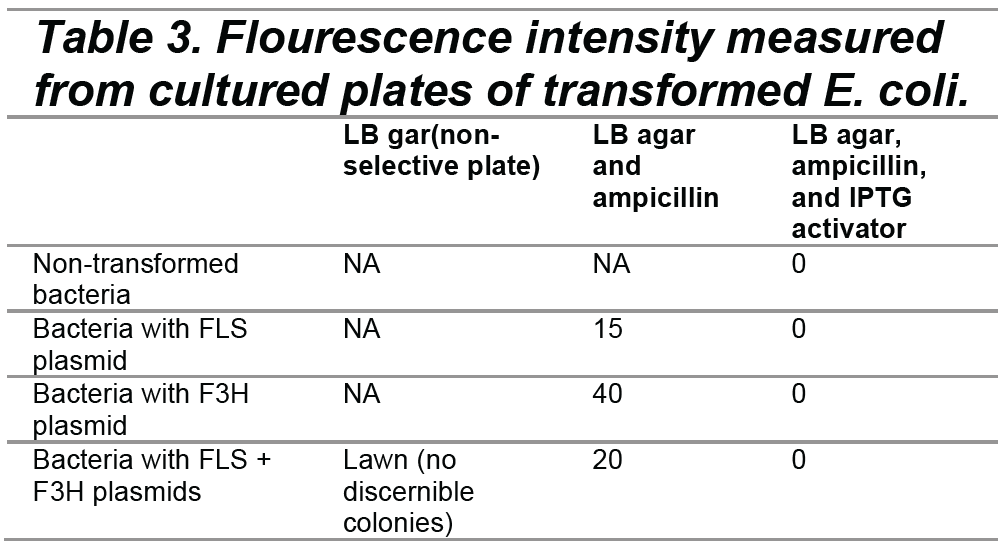
Number of bacterial colonies on each plate (16 hours of growth after plating)
|
|---|
Number of bacterial colonies on each plate – 16 hours of growth after plating (image locations correspond to data points listed in the table above)
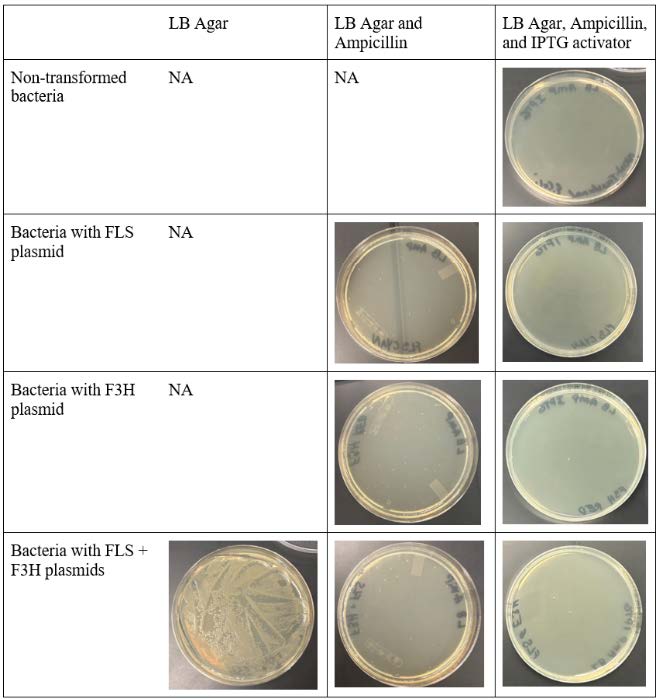
| Figure 2. Appearance of bacterial plates after X hours at 37°C. |
|
|---|
As shown in Figure 2, the non-selective plate containing cells with both FLS and F3H plasmids produced lawn growth. The plate groups of FLS, F3H, and FLS + F3H plasmids grown on selective plates with ampicillin produced colony growth. In contrast, the plate groups of FLS, F3H, and FLS+F3H plasmids grown on selective plates with IPTG did not produce cell growth.
From our plate observations, we can conclude that our E. coli cells were competent and that we successfully transformed them with our plasmids.
Had our cells not been competent, they would not have grown in colonies on the selective plates. There is a significant difference between the number of colonies on the plate with untransformed E.coli and the other three plates with transformed E.coli in Group 2 (containing LB and ampicillin) (see Figure 2). The presence of bacterial colonies growing on the three experimental plates with transformed E. coli in Group 2 shows that the E.coli on those plates have ampicillin antibiotic resistance, a gene coded for in our plasmids, though not associated with the same promoter as our genes of interest. However, our transformed E. coli did not grow in the presence of the activator, IPTG, as can be observed in Group 3.
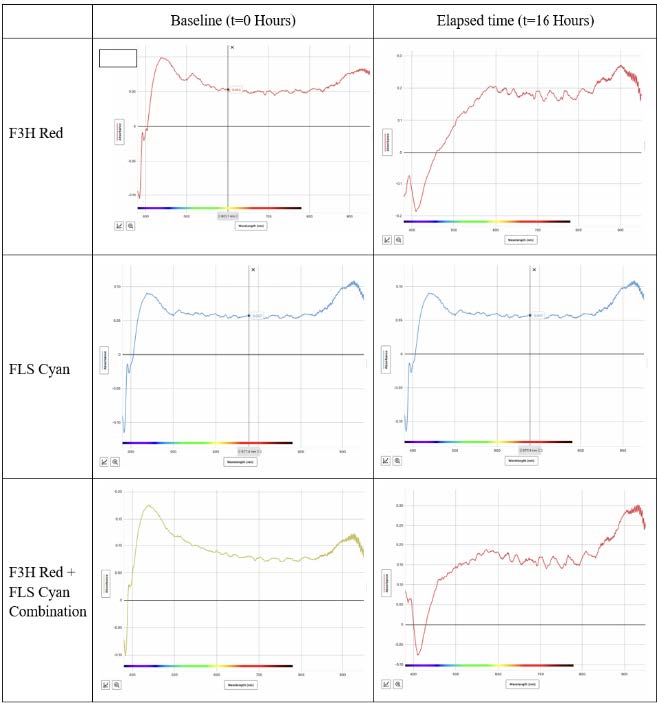
| Figure 3. Baseline (t=0 hrs, left) versus elapsed-time (t=16 hrs, right) absorbance levels of different wavelengths by solutions with competent E. coli and different plasmids/plasmid combinations. |
|
|---|
The light absorbance of the transformed bacterial cultures (grown in LB broth) was measured via spectroscopy (Figure 3). Within the visible light spectrum, absorbance increased in all transformed cultures after 16 hours of growth compared to the absorbance level at 0 hours of growth. This indicates that the bacteria survived and were able to undergo prokaryotic cell division after the transformation procedure.
Discussion
Based on our experiment’s results, it can be concluded that our plasmids were successfully transformed into competent bacteria. Transformed bacteria grew on the selective plates, whereas no growth occurred with untransformed bacteria. Thus, it can be concluded that the plasmid was successfully expressed in the E. coli because the ampicillin on those plates selected only the E. coli cells with ampicillin resistance, which were successfully transformed with the plasmid, which coded for that antibiotic resistance gene.
However, the transformed plates with ampicillin and the activator experienced no growth. The activator, IPTG, induces the expression of genes controlled by the lac promoter on both plasmids. The lac promoter should controls expression of the fluorescent protein pAmCyan or AsRed2. Since the plasmids were observed as being expressed in Group 2 (plated with only LB and ampicillin), it is unlikely that the ampicillin killed the bacteria. This is because we successfully grew our transformed bacteria on our other group of experimental plates, which contained LB, ampicillin, but no activator.
Additionally, it is unlikely that the fluorescent proteins, pAmCyan and AsRed2, killed or inhibited bacterial growth, as fluorescent proteins are regularly used to indicate expression of a plasmid and have been confirmed not to be cytotoxic.One potential explanation for the lack of cellular growth in group 3 is that the concentration of the activator, IPTG, led to cell death. While we used an IPTG concentration of 0.1 mM, which is within the generally recommended concentration range, it is still possible that thiswas too concentrated for our transformed cells to survive.Another potential explanation is that the FLS and F3H proteins produced in Group 3 had a cytotoxic effect, killing our bacteria.
Next Steps
The immediate next step would be to identify the cytotoxic reaction within the group of transformed plates with IPTG. Once identified, preferably via more background research, a second experiment can be conducted to avoid that reaction and successfully generate the fluorescence and FLS/F3H proteins in living cells. This next experiment, however, could take a few different forms. One approach could examine the effect of the concentration of IPTG on bacterial growth in our cultures, as overly-concentrated IPTG could have led to cell death. Another future experiment could be conducted in a eukaryotic cell, such as yeast, to reduce the potential for bacterially-cyotoxic effects. This would be used to examine the possibility of our proteins of interest, FLS and F3H, leading to bacterial death.
Another possible option would be pivoting to attempt to produce the kaempferol flavonoid directly in either E. coli or yeast cells. However, these cells might need to be specifically engineered to withstand the known cytotoxic effects of kaempferol (Smith et al., 2019) under certain cellular conditions if they were to produce the flavonoid successfully.
After the FLS and F3H proteins are successfully produced in vitro, the next step is to produce those proteins within the cattle’s feed. This way, the proteins would be generated within the gut of the cow, inhibiting methane production before methane leaves the cow.
Author Contributions
Throughout the project, each member of the group contributed to the project via background research, organizing meetings, and designing the experiment.
Acknowledgements
We would like to thank our mentor, Dr. Jennifer Watson, who donated hours of her time and provided us with remarkable insight and support. Without her, we would not have been able to complete this project. Additionally, we would like to thank our teacher, Matthew Kirkpatrick, for his unwavering support and dedication to his students.
References
Chang, A.Y., Chau, V.W.Y. Landas, J.A., & Pang, Y.. (2017). Preparation of calcium competent Escherichia coli and heat-shock transformation. JEMI Methods, 1(22-25).
Duan, L., Ding, W., Liu, X., Cheng, X., Cai, J., Hua, E., & Jiang, H. (2017). Biosynthesis and engineering of kaempferol in Saccharomyces cerevisiae. Microbial Cell Factories.
Oskoueian, A., Oskoueian, E., Abdullah, N. (2013). Effects of Flavonoids on Rumen Fermentation Activity, Methane Production, and Microbial Population. BioMed Research International, 2013, 349129.